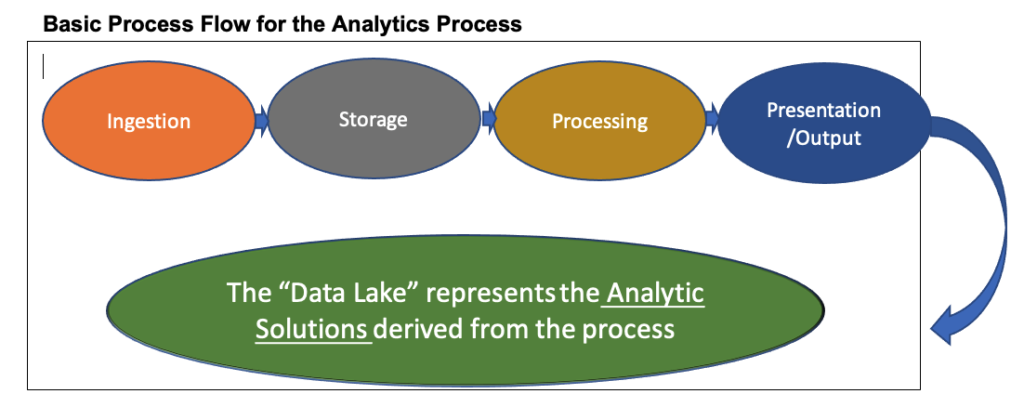
Analytics: The Basic Process for Using Analytics
Awareness of the increased use of analytics as a business tool continues to grow. Its extensive use in retail markets to track and analyze consumer buying habits and preferences is something that touches most all of us on a daily basis even if we do not know it as analytics. In sports, analytics is employed to dissect individual player performance and behavior patterns to alter team strategies and gain a competitive advantage. In these and other existing examples of analytics, the common threat is that the intent (by management) for its use is to address specific business problems and effect improvement in the company’s operations.
In the coating market the fundamental drivers for introducing analytics into the company are the same- new solutions to business problems and achieve a better understanding of those elements of the business that can be improved to affect improvements in company operations. Examples include examining sales trends over-time or by geography in relation to current operational practices or market variables. Understanding profitability variations by product line or by market in relation to a wide range of internal and external variables. Among these variables are things such as: Customer demand shifts/cycles; Shipment and warehousing cost details by region, by product line; or external variations based on raw material pricing, key imports, and export data on competitive products, etc.
Companies that do not currently do analytics or have very limited involvement with analytics face the challenge of where to start or how to begin to implement a viable analytics program. While the large, multi-national companies have resources in place to implement or expand the use of analytics, the medium-sized or smaller coatings companies normally are resource limited.
Beginning the process
The first step in the process of initiating an analytics program is to identify the stakeholders within the organization who have the need for this information. These individuals provide the drivers. In these sized companies, a senior manager normally will champion the effort to get things moving forward.

Implementing an analytics program, from the ground-up, has its critical path in the organization, approach, and implementation during the “ingestion phase’. It is in this phase that you make an initial determination of what data you want to bring into your program and from what sources. This includes consideration of the various internal sources of data which are available and importance to your overall objectives for using analytics. It is also includes identifying external data sources important to achieving data analysis that are critical to program goals and a “Data Lake” that delivers meaningful solutions.
For medium to smaller-sized companies, resourcing and experience is often a key consideration before beginning a program like analytics. It is in the ingestion phase that you set-the-table for the rest of the program. Experience and knowledge of the intricacies and options available to setting-up and implementing an analytics program in-house should not be under-estimated.
Existing data sets are often combination of structured, semi-structured and unstructured information. These data sets are contained in different formats based on customized software combined with data located in traditional Excel spread sheets. This can be data from logs, IOT (internet of things) electronic devices of various kinds, sensors, etc. Knowing how to bring in data from divergent data sources into a workable “Data Lake” is a complex task especially for those without experience. Back-tracking is not a pleasant experience. In this regard, bringing in outside experts with experience during this initial phase of the program is an important consideration.
Storage:
An analytics’ “Data Lake” is capable of spreading onto cloud environments that such as AWS (Amazon Web Services), Microsoft Azure or GCP (Google Chrome Platform). These can be configured on-site. Alternatively, data storage running on company hardware using HDFS (Apache Hadoop Distributed File System) storage is an alternative. Data storage formats such as Avro (serialized format) or Parquet (columnar format) are among the options that can be incorporated into the program architecture.
A hybrid approach is the other option which employs in-house data storage as the primary data source but also uses the cloud for processing large amounts of data on a periodic basis. It also provides a back-up for all data in the event the in-house system fails. In general, cost for cloud usage, especially as a hybrid approach, is low-cost. You only pay for use-time.
Processing
Data processing needs to be configured so it is a cost-effective solution able to run big data workloads in the analytics world. “Data Lake” jobs are smart enough to integrate with other applications while running the jobs. The objective of processing methodologies is to discover business insights from the data. The “company analytics team” needs to make sure that all the output objectives have been identified prior to beginning the design of the data processing methodology. The process stage is a critical step in implementation. Consideration needs to be given to accessing outside, experienced people to ensure the program will provide the quality of information intended from analytics is realized.
“Data Lake” processing techniques need to be capable enough to support all the business rules which are mandated. “Data Lake” needs to be capable enough to process the data from any real time data points. “Data Lake” processing architecture should be able to support multiple stream datasets at any point-in-time and process the data captured. Machine learning algorithms are one of the most complicated algorithms, Data lake is capable enough to host those and run in this environment.
Presentation:
“Data Lake” can feed data into various downstream systems by providing the required information platforms. In the color-coding industry “Data Lake” has the capabilities to integrate with any other external industry information. This feature provides the flexibility to build dash boards for various business users, “Data Lake” also provides the capability to generate reports on any given information at any point-in-time.
